
JEVANY / DOCUMENTATION
Inference efficiency
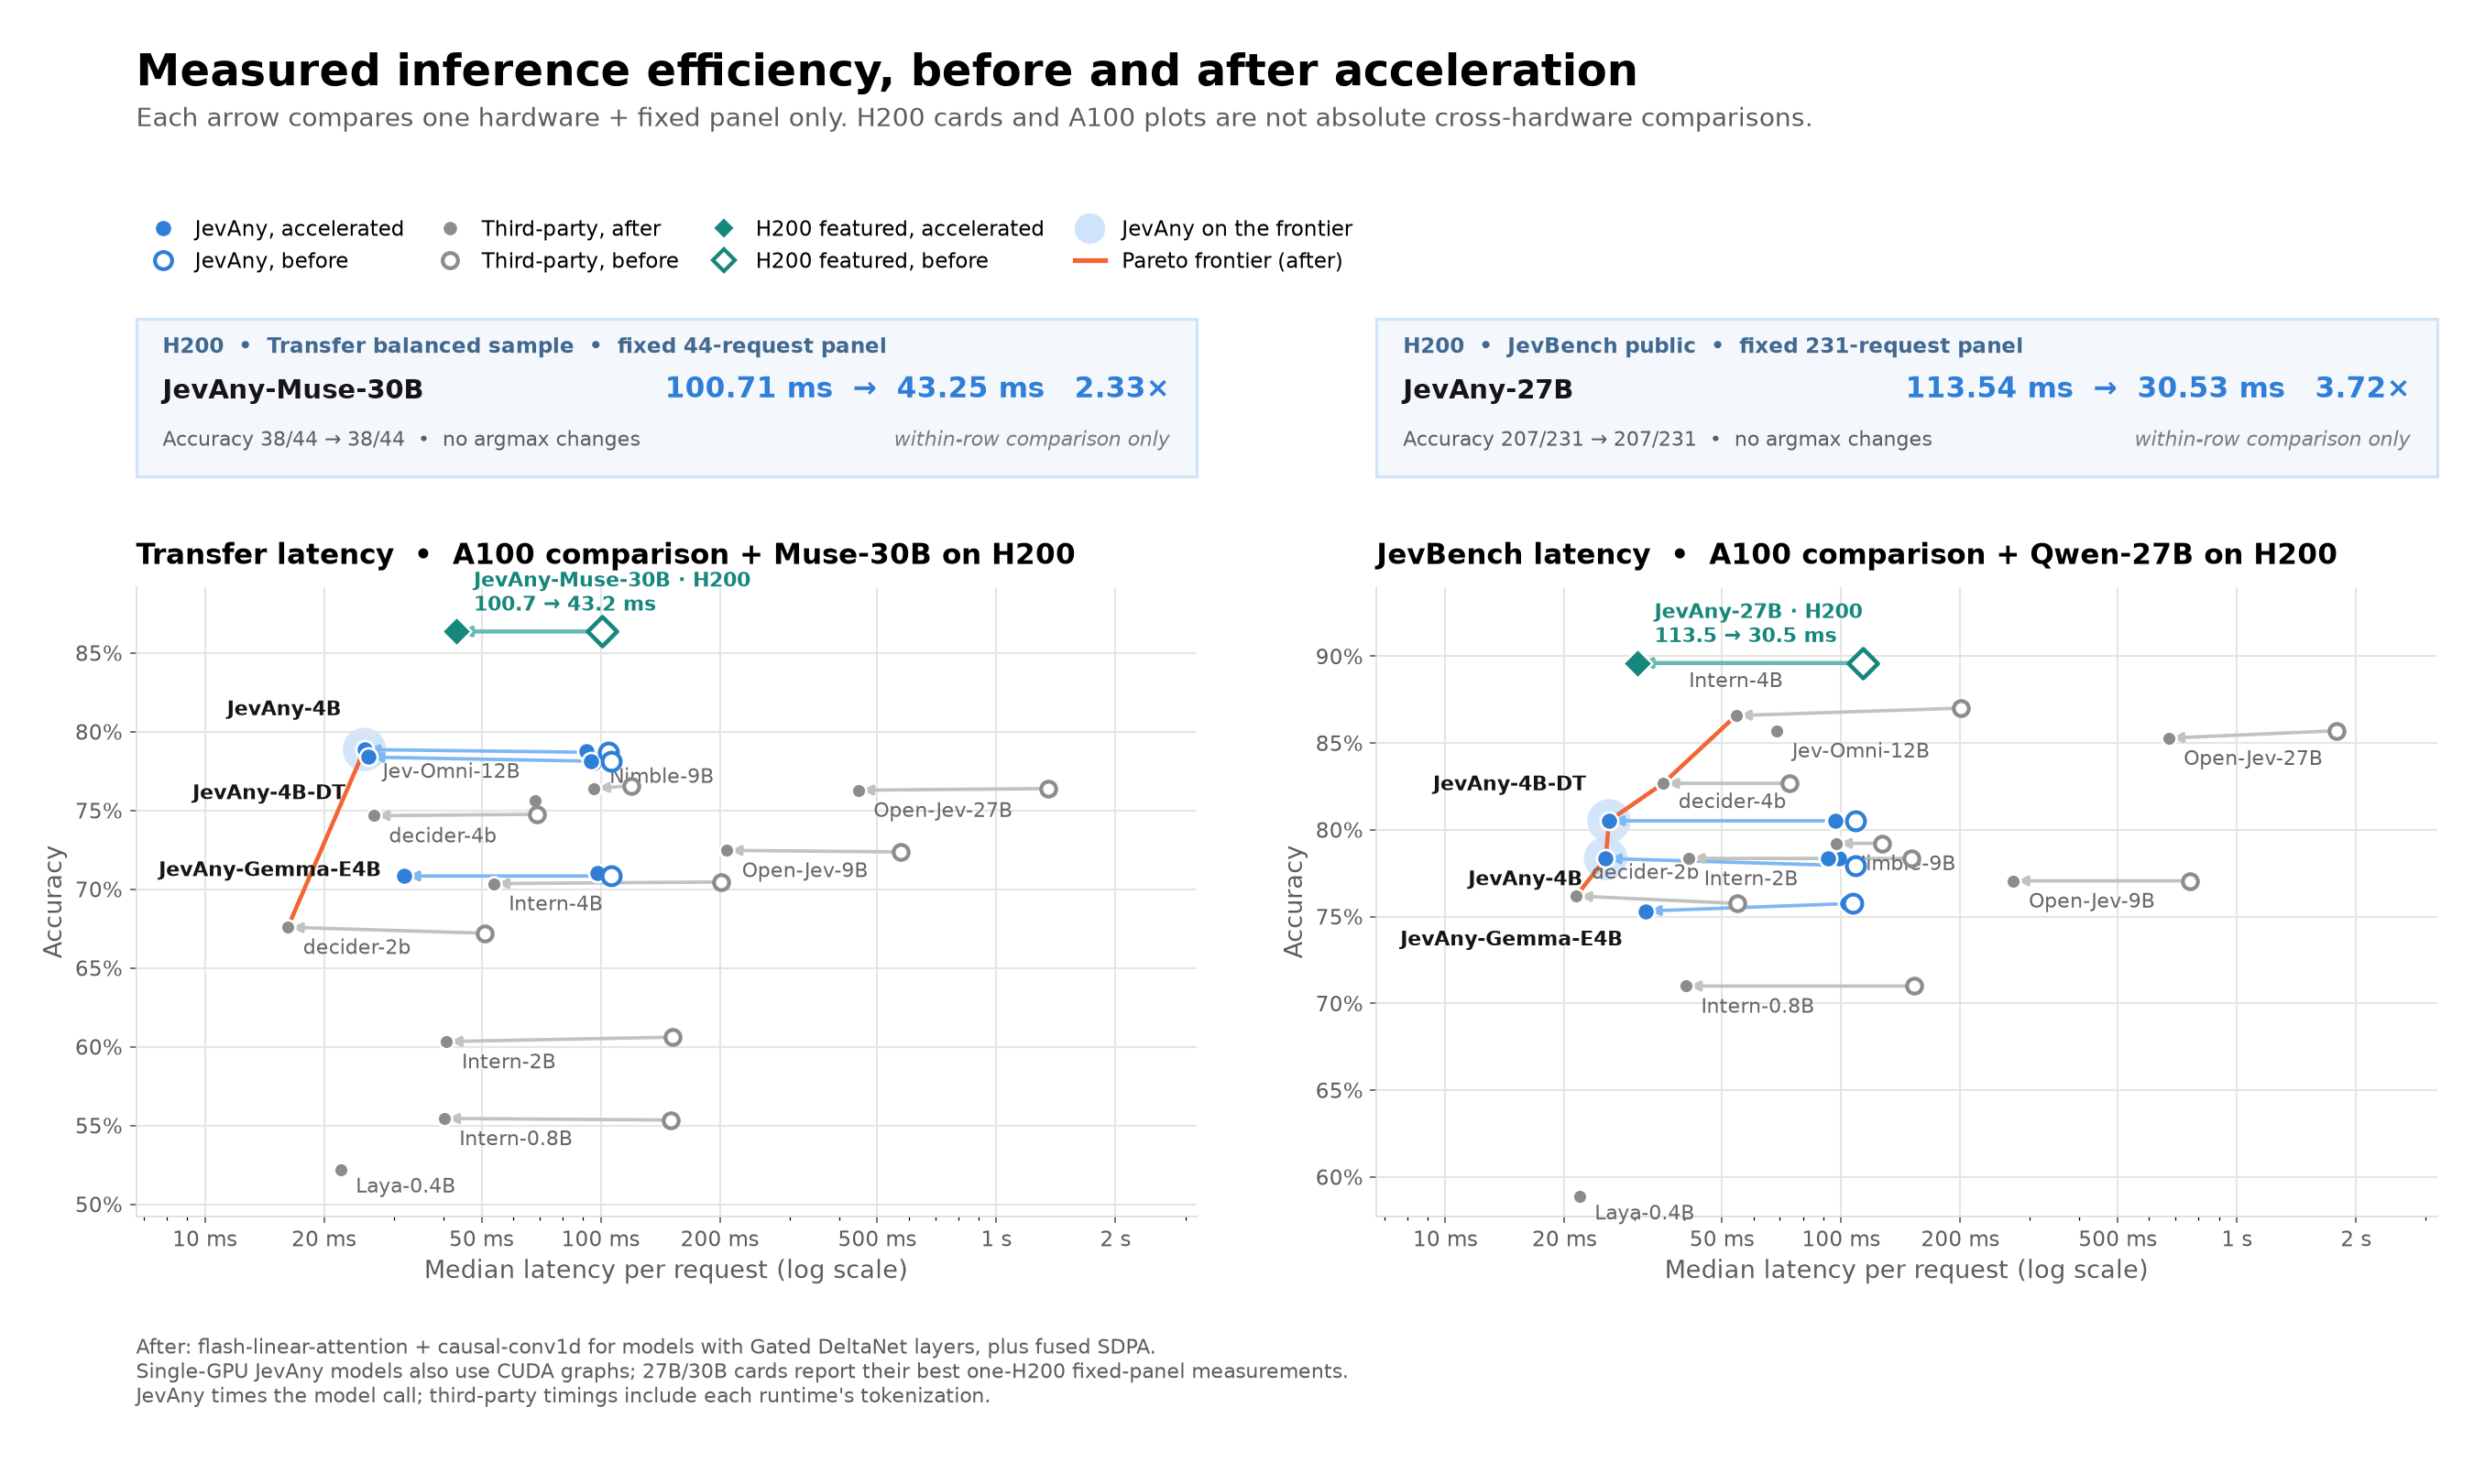
Measured accuracy and per-request latency of the JevAny releases and other
decision models before and after inference acceleration. The 27B and 30B
headline rows use their best single-H200 measurements; the 4B and third-party
comparison remains on A100-SXM4-40GB. The figure shows the H200 runs as diamond
before/after pairs and excludes them from the A100 Pareto frontier: compare
latency only within a before/after row, never across hardware or panels. How to enable each option is described
in Optional CUDA acceleration.
The plotted data are in
results/efficiency-h200-best-v1.json
and results/efficiency-a100-v1.json.
Summary
Whole-model CUDA Graph capture gives the largest-model speedups when the model fits on one H200:
| Model | Hardware | Fixed latency panel | Before median | After median | Speed-up | Accuracy |
|---|---|---|---|---|---|---|
| JevAny-Qwen3.8-27B | H200 | JevBench public, 231 | 113.54 ms | 30.53 ms | 3.72× | 207/231 → 207/231 |
| JevAny-Muse-Glimmer-30B | H200 | Transfer balanced sample, 44 | 100.71 ms | 43.25 ms | 2.33× | 38/44 → 38/44 |
Neither run had an argmax change. The 30B audit separates fused SDPA's 1.15× median gain from CUDA Graphs' further 2.03× gain, with 96 graph calls and no eager fallback. Its machine-readable result uses 44 short requests. The two H200 rows use different fixed panels, so their absolute latency and accuracy are not directly comparable. See the serving configuration.
The A100-40GB comparison below keeps the 4B JevAny rows and third-party models on one hardware class. The figure overlays the current 27B and 30B one-H200 measurements with distinct diamonds but does not include them in the A100 frontier. Historical layer-sharded A100 measurements for those releases remain in the machine-readable source and are omitted from the tables and plot.
| Model | GPUs | Default median | Accelerated median | Speed-up | Transfer accuracy |
|---|---|---|---|---|---|
| JevAny-Qwen3.5-4B | 1 | 104.6 ms | 25.3 ms | 4.1× | 78.68% → 78.87% |
| JevAny-Qwen3.5-4B-Direct-Token | 1 | 106.4 ms | 25.9 ms | 4.1× | 78.11% → 78.39% |
| JevAny-Gemma-4B | 1 | 106.3 ms | 31.9 ms | 3.3× | 70.84% → 70.84% |
Medians are on Transfer-v9. The single-GPU 4B models gain most from CUDA graphs, which remove per-kernel launch overhead at batch size one.
Setup
- Requests: batch size 1, serial requests; every request has one question.
- Hardware: headline 27B/30B rows use one H200; the comparison panels and detailed tables use A100-SXM4-40GB nodes.
- Suites:
- Transfer-v9 development split: 1,264 requests, of which 1,046 are scored.
- JevBench public: 231 questions.
- Latency:
- JevAny rows time the model call (backbone forward, readout and the probability transfer to the CPU) and exclude tokenization.
- Third-party rows time each project's own inference call, which includes its tokenization.
- Warm-up: A100 re-runs drop their first five requests; third-party Default rows come from the original evaluation runs. H200 warm-up is recorded with each fixed-panel measurement.
- Accuracy is re-measured in every configuration, so each table shows how far the faster kernels move predictions.
| Configuration | Meaning |
|---|---|
| Default | JevAny's evaluation path (LocalPredictor: math SDPA kernel, TF32 off) without the optional kernels below. Third-party models run their official inference code in the same kind of environment. |
| + kernels | flash-linear-attention 0.5.2 and causal-conv1d 1.7.0 installed; Transformers uses them for Gated DeltaNet layers. |
| + fused SDPA | PyTorch's fused SDPA kernels, which jevany serve uses by default. |
| + CUDA graphs | --cuda-graphs, with lengths captured up to 16,384 tokens. The current default captures up to --cuda-graph-max-tokens 2048, so longer rows stay eager. |
| + own CUDA graphs | decider's built-in CUDA-graph engine. |
Gemma 4, Jev-Omni (Gemma 4) and Laya (ModernBERT) have no Gated DeltaNet layers, so the kernels do not apply. Jev-Omni and Laya were therefore not re-run.
Transfer-v9
| Model | Configuration | GPUs | Accuracy | Mean (ms) | Median (ms) | P90 (ms) |
|---|---|---|---|---|---|---|
| JevAny-Qwen3.5-4B | Default | 1 | 78.68% | 105.4 | 104.6 | 112.7 |
| + kernels | 1 | 78.59% | 94.9 | 93.6 | 98.7 | |
| + kernels + fused SDPA | 1 | 78.78% | 93.6 | 92.1 | 96.7 | |
| + kernels + fused SDPA + CUDA graphs | 1 | 78.87% | 27.4 | 25.3 | 33.0 | |
| JevAny-Qwen3.5-4B-Direct-Token | Default | 1 | 78.11% | 106.6 | 106.4 | 113.7 |
| + kernels | 1 | 78.01% | 97.3 | 96.3 | 99.6 | |
| + kernels + fused SDPA | 1 | 78.11% | 95.7 | 94.6 | 98.0 | |
| + kernels + fused SDPA + CUDA graphs | 1 | 78.39% | 28.4 | 25.9 | 33.7 | |
| JevAny-Gemma-4B | Default | 1 | 70.84% | 107.1 | 106.3 | 109.3 |
| + kernels + fused SDPA | 1 | 71.03% | 98.8 | 97.9 | 101.4 | |
| + kernels + fused SDPA + CUDA graphs | 1 | 70.84% | 34.5 | 31.9 | 39.9 | |
| Open-Jev-27B-v1.1 | Default | 3 | 76.39% | 1709.6 | 1348.6 | 4336.8 |
| + kernels | 3 | 76.29% | 594.2 | 447.6 | 1486.8 | |
| Open-Jev-9B | Default | 1 | 72.37% | 746.4 | 572.6 | 1906.3 |
| + kernels | 1 | 72.47% | 268.1 | 208.2 | 687.4 | |
| Bespoke-Nimble-9B | Default | 1 | 76.58% | 123.8 | 119.7 | 141.1 |
| + kernels | 1 | 76.39% | 97.3 | 96.3 | 101.7 | |
| Intern-Decision-4B | Default | 1 | 70.46% | 203.5 | 201.1 | 214.1 |
| + kernels | 1 | 70.36% | 53.8 | 53.6 | 54.4 | |
| Intern-Decision-2B | Default | 1 | 60.61% | 152.9 | 152.0 | 162.7 |
| + kernels | 1 | 60.33% | 40.9 | 40.8 | 41.4 | |
| Intern-Decision-0.8B | Default | 1 | 55.35% | 151.9 | 150.7 | 162.0 |
| + kernels | 1 | 55.45% | 40.3 | 40.2 | 40.7 | |
| decider-4b | Default | 1 | 74.76% | 70.0 | 68.9 | 78.7 |
| + kernels + own CUDA graphs | 1 | 74.67% | 393.7* | 26.7 | 47.9 | |
| decider-2b | Default | 1 | 67.21% | 53.1 | 50.9 | 64.2 |
| + kernels + own CUDA graphs | 1 | 67.59% | 289.4* | 16.2 | 22.5 | |
| Jev-Omni | Default (not re-run) | 1 | 75.62% | 69.3 | 68.4 | 69.7 |
| Laya | Default (not re-run) | 1 | 52.20% | 22.9 | 22.0 | 25.0 |
JevBench public
| Model | Configuration | GPUs | Accuracy | Mean (ms) | Median (ms) | P90 (ms) |
|---|---|---|---|---|---|---|
| JevAny-Qwen3.5-4B | Default | 1 | 77.92% | 184.9 | 108.8 | 474.5 |
| + kernels | 1 | 78.35% | 174.0 | 98.5 | 282.2 | |
| + kernels + fused SDPA | 1 | 78.35% | 117.6 | 92.7 | 216.4 | |
| + kernels + fused SDPA + CUDA graphs | 1 | 78.35% | 73.7 | 25.4 | 229.1 | |
| JevAny-Qwen3.5-4B-Direct-Token | Default | 1 | 80.52% | 186.7 | 108.5 | 480.7 |
| + kernels | 1 | 80.52% | 134.5 | 96.0 | 283.0 | |
| + kernels + fused SDPA | 1 | 80.52% | 119.9 | 96.6 | 217.8 | |
| + kernels + fused SDPA + CUDA graphs | 1 | 80.52% | 74.5 | 25.9 | 229.4 | |
| JevAny-Gemma-4B | Default | 1 | 75.76% | 179.2 | 107.2 | 453.7 |
| + kernels + fused SDPA | 1 | 75.76% | 138.3 | 103.4 | 281.2 | |
| + kernels + fused SDPA + CUDA graphs | 1 | 75.32% | 94.0 | 32.1 | 288.0 | |
| Open-Jev-27B-v1.1 | Default | 3 | 85.71% | 2201.9 | 1785.3 | 5477.1 |
| + kernels | 3 | 85.28% | 939.9 | 671.3 | 2744.4 | |
| Open-Jev-9B | Default | 1 | 77.06% | 902.0 | 761.0 | 2043.0 |
| + kernels | 1 | 77.06% | 354.5 | 272.5 | 880.7 | |
| Bespoke-Nimble-9B | Default | 1 | 79.22% | 198.2 | 126.8 | 480.4 |
| + kernels | 1 | 79.22% | 141.5 | 97.0 | 312.5 | |
| Intern-Decision-4B | Default | 1 | 87.01% | 260.6 | 200.2 | 480.6 |
| + kernels | 1 | 86.58% | 120.9 | 54.2 | 147.5 | |
| Intern-Decision-2B | Default | 1 | 78.35% | 192.0 | 150.4 | 351.6 |
| + kernels | 1 | 78.35% | 46.4 | 41.2 | 67.0 | |
| Intern-Decision-0.8B | Default | 1 | 71.00% | 193.0 | 153.1 | 347.1 |
| + kernels | 1 | 71.00% | 42.2 | 40.5 | 47.9 | |
| decider-4b | Default | 1 | 82.68% | 143.6 | 73.9 | 348.5 |
| + kernels + own CUDA graphs | 1 | 82.68% | 1962.0* | 35.5 | 259.8 | |
| decider-2b | Default | 1 | 75.76% | 89.2 | 54.5 | 189.1 |
| + kernels + own CUDA graphs | 1 | 76.19% | 13993.8* | 21.4 | 127.0 | |
| Jev-Omni | Default (not re-run) | 1 | 85.71% | 146.4 | 68.8 | 436.7 |
| Laya | Default (not re-run) | 1 | 58.87% | 22.3 | 21.8 | 24.7 |
* decider compiles each new input shape on first use, and that compilation is included in the mean. Its median and p90 describe steady-state latency.
Notes
- JevBench conversion: JevBench was converted from the public data with
scripts/build_external_eval.py. The resultingdevelopment.jsonldiffers from the officialjevbench-public-v1.4.2.2file, so JevBench accuracies here can differ from EVALUATION.md by a few hard-tier questions. - JevBench p90 with CUDA graphs: p90 is slightly higher with graphs than without, because long requests were padded to the next captured length. The current 2,048-token capture limit keeps those requests on eager inference.
- Comparing across rows: each before/after pair uses one GPU type and fixed panel. The detailed comparison tables use A100s, but some rows span different nodes of the cluster, adding a few percent of run-to-run variation. Do not compare their absolute latency with the H200 headline cards.
Regenerate the figure from the repository root with
python scripts/plot_efficiency.py; it reads both efficiency JSON files linked
above by default.